 Catalogue PIGMA
*
Type of resources
Available actions
Topics
Keywords
Contact for the resource
Provided by
Years
Formats
Representation types
Update frequencies
status
Service types
Scale
Resolution
-

We assembled a dataset of 14C-based productivity measurements to understand the critical variables required for accurate assessment of daily depth-integrated phytoplankton carbon fixation (PP(PPeu)u) from measurements of sea surface pigment concentrations (Csat)(Csat). From this dataset, we developed a light-dependent, depth-resolved model for carbon fixation (VGPM) that partitions environmental factors affecting primary production into those that influence the relative vertical distribution of primary production (Pz)z) and those that control the optimal assimilation efficiency of the productivity profile (P(PBopt). The VGPM accounted for 79% of the observed variability in Pz and 86% of the variability in PPeu by using measured values of PBopt. Our results indicate that the accuracy of productivity algorithms in estimating PPeu is dependent primarily upon the ability to accurately represent variability in Pbopt. We developed a temperature-dependent Pbopt model that was used in conjunction with monthly climatological images of Csat sea surface temperature, and cloud-corrected estimates of surface irradiance to calculate a global annual phytoplankton carbon fixation (PPannu) rate of 43.5 Pg C yr‒1. The geographical distribution of PPannu was distinctly different than results from previous models. Our results illustrate the importance of focusing Pbopt model development on temporal and spatial, rather than the vertical, variability.
-

'''Short description:''' Le modèle biogéochimique ECO-MARS3D sur la façade Manche Atlantique (PREVIMER_B1-ECOMARS3D-MANGA4000) est un modèle 3D de résolution spatiale 4km qui fournit les concentrations de nutriments et de plancton toutes les heures sur 30 niveaux (fenêtre de prévision à 4 jours). '''Paramètres calculés :''' Les paramètres calculés sont les suivants : * SAL : sea_water_salinity * TEMP : sea_water_temperature * suspended_inorganic_particulate_matter : mass_concentration_of_suspended_matter_in_sea_water * nanopicoplankton_nitrogen : mole_concentration_of_nanoplankton_expressed_as_nitrogen_in_sea_water * diatom_nitrogen : mole_concentration_of_diatoms_expressed_as_nitrogen_in_sea_water * dinoflagellate_nitrogen : mole_concentration_of_dinoflagellates_expressed_as_nitrogen_in_sea_water * microzooplankton_nitrogen : mole_concentration_of_microzooplankton_expressed_as_nitrogen_in_sea_water * mesozooplankton_nitrogen : mole_concentration_of_mesozooplankton_expressed_as_nitrogen_in_sea_water * colonial_phaeocystis_nitrogen : mole_concentration_of_colonial_phaeocystis_expressed_as_nitrogen_in_sea_water * phaeocystis_mucus : concentration_of_phaeocystis_mucus_expressed_as_mass_in_sea_water * ammonium : mole_concentration_of_ammonium_in_sea_water * nitrate : mole_concentration_of_nitrate_in_sea_water * dissolved_silicate : mole_concentration_of_silicate_in_sea_water * dissolved_phosphate : mole_concentration_of_phosphate_in_sea_water * dissolved_oxygen : dissolved_oxygen_in_water_column * cumulative_nanoflagellate_carbon_production : cumulative_nanoflagellate_production_expressed_as_carbon_in_sea_water * cumulative_diatom_carbon_production : cumulative_diatom_production_expressed_as_carbon_in_sea_water * cumulative_dinoflagellate_carbon_production : cumulative_dinoflagellate_production_expressed_as_carbon_in_sea_water * cumulative_phaeocystis_carbon_production : cumulative_phaeocystis_production_expressed_as_carbon_in_sea_water * organic_nitrogen_benth : mole_concentration_of_organic_detritus_expressed_as_nitrogen_in_benthos Les paramètres diagnostiques calculés sont les suivants : * XE : sea_surface_height_above_geoid * maximum_de_diat : maximum_diatom_mass_concentration_in_sea_water * maximum_de_dino : maximum_dinoflagellate_mass_concentration_in_sea_water * maximum_de_nano : maximum_nanoflagellate_mass_concentration_in_sea_water * grad_vert_salinite : maximum_vertical_gradient_of_sea_water_salinity * grad_vert_temp : maximum_vertical_gradient_of_sea_water_temperature * extinction_lumineuse : light_extinction_in_sea_water * prod_diat : cumulated_production_of_diatoms_in_sea_water_column_expressed_in_carbon * prod_dino : cumulated_production_of_dinoflagellates_in_sea_water_column_expressed_in_carbon * prod_nano : cumulated_production_of_nanoflagellates_in_sea_water_column_expressed_in_carbon * chlorophylle_a : chlorophyll_mass_concentration_in_sea_water * prod_cumul_chloro : cumulated_total_production_in_sea_water_column_expressed_in_carbon * maximum_de_phaeocystis : maximum_phaeocystis_mass_concentration_in_sea_water * prod_phaeocystis : cumulated_production_of_phaeocystis_in_sea_water_column_expressed_in_carbon * oxygen_saturation : oxygen_saturation * ammoniumGIRON_tracer_sign: mole_concentration_of_ammonium_in_sea_waterGIRON_tracer_sign * ammoniumGIRON_tracer_age: mole_concentration_of_ammonium_in_sea_waterGIRON_tracer_age * nitrateGIRON_tracer_sign: mole_concentration_of_nitrate_in_sea_waterGIRON_tracer_sign * nitrateGIRON_tracer_age: mole_concentration_of_nitrate_in_sea_waterGIRON_tracer_age * nanopicoplankton_nitrogenGIRON_tracer_sign: mole_concentration_of_nanoplankton_expressed_as_nitrogen_in_sea_waterGIRON_tracer_sign * nanopicoplankton_nitrogenGIRON_tracer_age: mole_concentration_of_nanoplankton_expressed_as_nitrogen_in_sea_waterGIRON_tracer_age * diatom_nitrogenGIRON_tracer_sign: mole_concentration_of_diatoms_expressed_as_nitrogen_in_sea_waterGIRON_tracer_sign * diatom_nitrogenGIRON_tracer_age: mole_concentration_of_diatoms_expressed_as_nitrogen_in_sea_waterGIRON_tracer_age * dinoflagellate_nitrogenGIRON_tracer_sign: mole_concentration_of_dinoflagellates_expressed_as_nitrogen_in_sea_waterGIRON_tracer_sign * dinoflagellate_nitrogenGIRON_tracer_age: mole_concentration_of_dinoflagellates_expressed_as_nitrogen_in_sea_waterGIRON_tracer_age * microzooplankton_nitrogenGIRON_tracer_sign: mole_concentration_of_microzooplankton_expressed_as_nitrogen_in_sea_waterGIRON_tracer_sign * microzooplankton_nitrogenGIRON_tracer_age: mole_concentration_of_microzooplankton_expressed_as_nitrogen_in_sea_waterGIRON_tracer_age * mesozooplankton_nitrogenGIRON_tracer_sign: mole_concentration_of_mesozooplankton_expressed_as_nitrogen_in_sea_waterGIRON_tracer_sign * mesozooplankton_nitrogenGIRON_tracer_age: mole_concentration_of_mesozooplankton_expressed_as_nitrogen_in_sea_waterGIRON_tracer_age * detrital_nitrogenGIRON_tracer_sign: mole_concentration_of_organic_detritus_expressed_as_nitrogen_in_sea_waterGIRON_tracer_sign * detrital_nitrogenGIRON_tracer_age: mole_concentration_of_organic_detritus_expressed_as_nitrogen_in_sea_waterGIRON_tracer_age * colonial_phaeocystis_nitrogenGIRON_tracer_sign: mole_concentration_of_colonial_phaeocystis_expressed_as_nitrogen_in_sea_waterGIRON_tracer_sign * colonial_phaeocystis_nitrogenGIRON_tracer_age: mole_concentration_of_colonial_phaeocystis_expressed_as_nitrogen_in_sea_waterGIRON_tracer_age * phaeocystis_cells_nitrogenGIRON_tracer_sign: mole_concentration_of_phaeocystis_cells_expressed_as_nitrogen_in_sea_waterGIRON_tracer_sign * phaeocystis_cells_nitrogenGIRON_tracer_age: mole_concentration_of_phaeocystis_cells_expressed_as_nitrogen_in_sea_waterGIRON_tracer_age * organic_nitrogen_benthGIRON_tracer_sign: mole_concentration_of_organic_detritus_expressed_as_nitrogen_in_benthosGIRON_tracer_sign * organic_nitrogen_benthGIRON_tracer_age: mole_concentration_of_organic_detritus_expressed_as_nitrogen_in_benthosGIRON_tracer_age * phytoplankton_sign_N_GIRON: nitrogen_fraction_in_phytoplankton_from_source_GIRON * phytoplankton_age_N_GIRON: age_of_nitrogen_fraction_in_phytoplankton_from_source_GIRON * ammoniumLOIRE_tracer_sign: mole_concentration_of_ammonium_in_sea_waterLOIRE_tracer_sign * ammoniumLOIRE_tracer_age: mole_concentration_of_ammonium_in_sea_waterLOIRE_tracer_age * nitrateLOIRE_tracer_sign: mole_concentration_of_nitrate_in_sea_waterLOIRE_tracer_sign * nitrateLOIRE_tracer_age: mole_concentration_of_nitrate_in_sea_waterLOIRE_tracer_age * nanopicoplankton_nitrogenLOIRE_tracer_sign: mole_concentration_of_nanoplankton_expressed_as_nitrogen_in_sea_waterLOIRE_tracer_sign * nanopicoplankton_nitrogenLOIRE_tracer_age: mole_concentration_of_nanoplankton_expressed_as_nitrogen_in_sea_waterLOIRE_tracer_age * diatom_nitrogenLOIRE_tracer_sign: mole_concentration_of_diatoms_expressed_as_nitrogen_in_sea_waterLOIRE_tracer_sign * diatom_nitrogenLOIRE_tracer_age: mole_concentration_of_diatoms_expressed_as_nitrogen_in_sea_waterLOIRE_tracer_age * dinoflagellate_nitrogenLOIRE_tracer_sign: mole_concentration_of_dinoflagellates_expressed_as_nitrogen_in_sea_waterLOIRE_tracer_sign * dinoflagellate_nitrogenLOIRE_tracer_age: mole_concentration_of_dinoflagellates_expressed_as_nitrogen_in_sea_waterLOIRE_tracer_age * microzooplankton_nitrogenLOIRE_tracer_sign: mole_concentration_of_microzooplankton_expressed_as_nitrogen_in_sea_waterLOIRE_tracer_sign * microzooplankton_nitrogenLOIRE_tracer_age: mole_concentration_of_microzooplankton_expressed_as_nitrogen_in_sea_waterLOIRE_tracer_age * mesozooplankton_nitrogenLOIRE_tracer_sign: mole_concentration_of_mesozooplankton_expressed_as_nitrogen_in_sea_waterLOIRE_tracer_sign * mesozooplankton_nitrogenLOIRE_tracer_age: mole_concentration_of_mesozooplankton_expressed_as_nitrogen_in_sea_waterLOIRE_tracer_age * detrital_nitrogenLOIRE_tracer_sign: mole_concentration_of_organic_detritus_expressed_as_nitrogen_in_sea_waterLOIRE_tracer_sign * detrital_nitrogenLOIRE_tracer_age: mole_concentration_of_organic_detritus_expressed_as_nitrogen_in_sea_waterLOIRE_tracer_age * colonial_phaeocystis_nitrogenLOIRE_tracer_sign: mole_concentration_of_colonial_phaeocystis_expressed_as_nitrogen_in_sea_waterLOIRE_tracer_sign * colonial_phaeocystis_nitrogenLOIRE_tracer_age: mole_concentration_of_colonial_phaeocystis_expressed_as_nitrogen_in_sea_waterLOIRE_tracer_age * phaeocystis_cells_nitrogenLOIRE_tracer_sign: mole_concentration_of_phaeocystis_cells_expressed_as_nitrogen_in_sea_waterLOIRE_tracer_sign * phaeocystis_cells_nitrogenLOIRE_tracer_age: mole_concentration_of_phaeocystis_cells_expressed_as_nitrogen_in_sea_waterLOIRE_tracer_age * organic_nitrogen_benthLOIRE_tracer_sign: mole_concentration_of_organic_detritus_expressed_as_nitrogen_in_benthosLOIRE_tracer_sign * organic_nitrogen_benthLOIRE_tracer_age: mole_concentration_of_organic_detritus_expressed_as_nitrogen_in_benthosLOIRE_tracer_age * phytoplankton_sign_N_LOIRE: nitrogen_fraction_in_phytoplankton_from_source_LOIRE * phytoplankton_age_N_LOIRE: age_of_nitrogen_fraction_in_phytoplankton_from_source_LOIRE * ammoniumSEINE_tracer_sign: mole_concentration_of_ammonium_in_sea_waterSEINE_tracer_sign * ammoniumSEINE_tracer_age: mole_concentration_of_ammonium_in_sea_waterSEINE_tracer_age * nitrateSEINE_tracer_sign: mole_concentration_of_nitrate_in_sea_waterSEINE_tracer_sign * nitrateSEINE_tracer_age: mole_concentration_of_nitrate_in_sea_waterSEINE_tracer_age * nanopicoplankton_nitrogenSEINE_tracer_sign: mole_concentration_of_nanoplankton_expressed_as_nitrogen_in_sea_waterSEINE_tracer_sign * nanopicoplankton_nitrogenSEINE_tracer_age: mole_concentration_of_nanoplankton_expressed_as_nitrogen_in_sea_waterSEINE_tracer_age * diatom_nitrogenSEINE_tracer_sign: mole_concentration_of_diatoms_expressed_as_nitrogen_in_sea_waterSEINE_tracer_sign * diatom_nitrogenSEINE_tracer_age: mole_concentration_of_diatoms_expressed_as_nitrogen_in_sea_waterSEINE_tracer_age * dinoflagellate_nitrogenSEINE_tracer_sign: mole_concentration_of_dinoflagellates_expressed_as_nitrogen_in_sea_waterSEINE_tracer_sign * dinoflagellate_nitrogenSEINE_tracer_age: mole_concentration_of_dinoflagellates_expressed_as_nitrogen_in_sea_waterSEINE_tracer_age * microzooplankton_nitrogenSEINE_tracer_sign: mole_concentration_of_microzooplankton_expressed_as_nitrogen_in_sea_waterSEINE_tracer_sign * microzooplankton_nitrogenSEINE_tracer_age: mole_concentration_of_microzooplankton_expressed_as_nitrogen_in_sea_waterSEINE_tracer_age * mesozooplankton_nitrogenSEINE_tracer_sign: mole_concentration_of_mesozooplankton_expressed_as_nitrogen_in_sea_waterSEINE_tracer_sign * mesozooplankton_nitrogenSEINE_tracer_age: mole_concentration_of_mesozooplankton_expressed_as_nitrogen_in_sea_waterSEINE_tracer_age * detrital_nitrogenSEINE_tracer_sign: mole_concentration_of_organic_detritus_expressed_as_nitrogen_in_sea_waterSEINE_tracer_sign * detrital_nitrogenSEINE_tracer_age: mole_concentration_of_organic_detritus_expressed_as_nitrogen_in_sea_waterSEINE_tracer_age * colonial_phaeocystis_nitrogenSEINE_tracer_sign: mole_concentration_of_colonial_phaeocystis_expressed_as_nitrogen_in_sea_waterSEINE_tracer_sign * colonial_phaeocystis_nitrogenSEINE_tracer_age: mole_concentration_of_colonial_phaeocystis_expressed_as_nitrogen_in_sea_waterSEINE_tracer_age * phaeocystis_cells_nitrogenSEINE_tracer_sign: mole_concentration_of_phaeocystis_cells_expressed_as_nitrogen_in_sea_waterSEINE_tracer_sign * phaeocystis_cells_nitrogenSEINE_tracer_age: mole_concentration_of_phaeocystis_cells_expressed_as_nitrogen_in_sea_waterSEINE_tracer_age * organic_nitrogen_benthSEINE_tracer_sign: mole_concentration_of_organic_detritus_expressed_as_nitrogen_in_benthosSEINE_tracer_sign * organic_nitrogen_benthSEINE_tracer_age: mole_concentration_of_organic_detritus_expressed_as_nitrogen_in_benthosSEINE_tracer_age * phytoplankton_sign_N_SEINE: nitrogen_fraction_in_phytoplankton_from_source_SEINE * phytoplankton_age_N_SEINE: age_of_nitrogen_fraction_in_phytoplankton_from_source_SEINE
-

'''Short description:''' Mediterranean Sea - near real-time (NRT) in situ quality controlled observations, hourly updated and distributed by INSTAC within 24-48 hours from acquisition in average '''DOI (product) :''' https://doi.org/10.48670/moi-00044
-
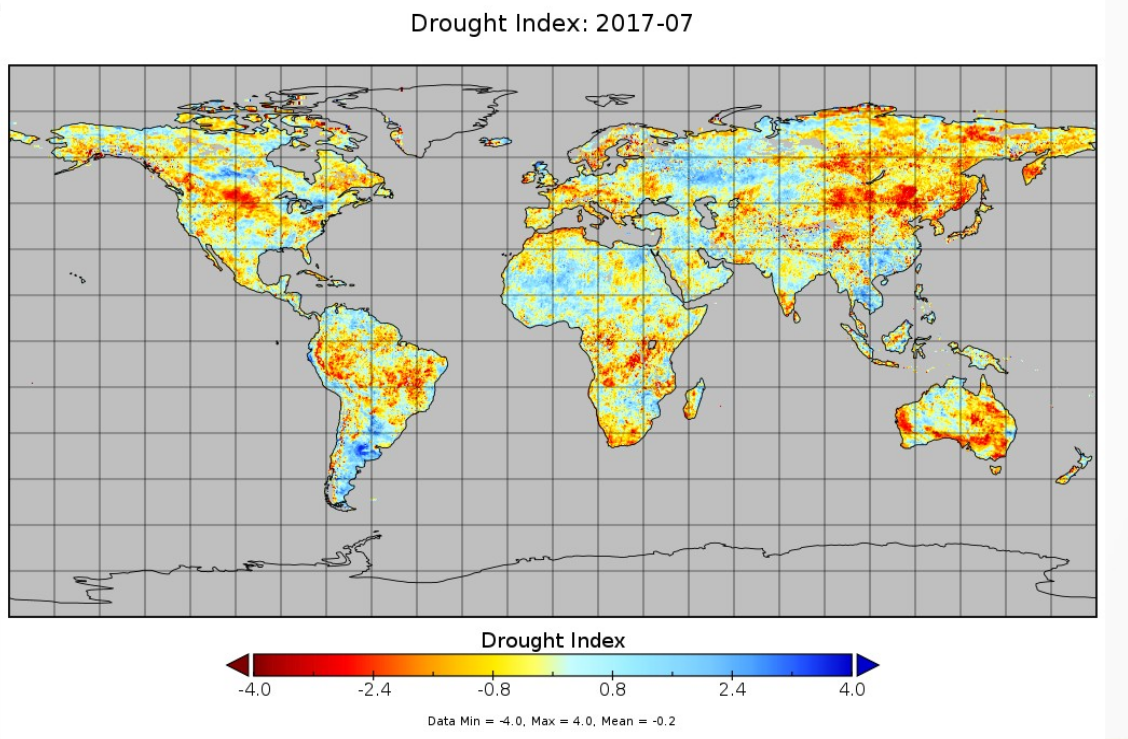
The drought index (DI) is computed using SMOS derived root zone soil moisture (RZSM) monthly fields. The concept is to consider 13 years of SMOS data (2010-2022). The RZSM monthly mean and max over the period is iused to compute a soil water deficit to remove seasonal variability. from teh soil water deficit a soil moisture drought index is computed .The range of values for SMDI lies between -4 to +4, with -4 representing extreme dry conditions and +4 representing extreme wet conditions.
-
'''Short description:''' Altimeter satellite gridded Sea Level Anomalies (SLA) computed with respect to a twenty-year [1993, 2012] mean. The SLA is estimated by Optimal Interpolation, merging the measurement from the different altimeter missions available (see QUID document or http://duacs.cls.fr [http://duacs.cls.fr] pages for processing details). The product gives additional variables (i.e. Absolute Dynamic Topography and geostrophic currents (absolute and anomalies)). This product is processed by the DUACS multimission altimeter data processing system. It serves in near-real time the main operational oceanography and climate forecasting centers in Europe and worldwide. It processes data from all altimeter missions: Jason-3, Sentinel-3A, HY-2A, Saral/AltiKa, Cryosat-2, Jason-2, Jason-1, T/P, ENVISAT, GFO, ERS1/2. It provides a consistent and homogeneous catalogue of products for varied applications, both for near real time applications and offline studies. To produce maps of Sea Level Anomalies (SLA) and Absolute Dynamic Topography (ADT) in near-real-time, the system uses the along-track altimeter missions from products called SEALEVEL*_PHY_L3_NRT_OBSERVATIONS_008_*. Finally an Optimal Interpolation is made merging all the flying satellites in order to compute gridded SLA and ADT. The geostrophic currents are derived from sla (geostrophic velocities anomalies, ugosa and vgosa variables) and from adt (absolute geostrophic velicities, ugos and vgos variables). Note that the gridded products can be visualized on the LAS (Live Access Data) Aviso+ web page (http://www.aviso.altimetry.fr/en/data/data-access/las-live-access-server.html [http://www.aviso.altimetry.fr/en/data/data-access/las-live-access-server.html]).
-
-

Built and developed by researchers, to ensure that everyone can join in Open Science. The OpenAIRE project, in the vanguard of the open access and open data movements in Europe was commissioned by the EC to support their nascent Open Data policy by providing a catch-all repository for EC funded research. CERN, an OpenAIRE partner and pioneer in open source, open access and open data, provided this capability and Zenodo was launched in May 2013. In support of its research programme CERN has developed tools for Big Data management and extended Digital Library capabilities for Open Data. Through Zenodo these Big Science tools could be effectively shared with the long-tail of research. Zenodo helps researchers receive credit by making the research results citable and through OpenAIRE integrates them into existing reporting lines to funding agencies like the European Commission. Citation information is also passed to DataCite and onto the scholarly aggregators.
-

Les Schémas Régionaux Climat Air Énergie doivent définir des orientations destinées à prévenir ou réduire la pollution atmosphérique. Elles seront renforcées dans les « zones sensibles » où la qualité de l’air sera jugée prioritaire. La définition de ces zones a donc un impact important. Pour la région Aquitaine, 394 mailles kilométriques sont considérées comme sensibles. Ce sont 108 communes qui ont été sélectionnées comme étant sensibles au regard de l’ensemble des conditions de sélection. Ces communes représentent ainsi 8 % de la superficie du territoire et 42 % de la population en Aquitaine. La carte met en évidence le rôle du corridor nord sud dans la dégradation de la qualité de l’air en Aquitaine. C’est sur cet axe, ainsi que dans les agglomérations de la région, que l’on retrouve la plupart de ces communes classées sensibles.
-

"'Short description: ''' Global Ocean - This delayed mode product designed for reanalysis purposes integrates the best available version of in situ data for ocean surface and subsurface currents. Current data from 5 different types of instruments are distributed: * The drifter's near-surface velocities computed from their position measurements. In addition, a wind slippage correction is provided from 1993. Information on the presence of the drogue of the drifters is also provided. * The near-surface zonal and meridional total velocities, and near-surface radial velocities, measured by High Frequency (HF) radars that are part of the European HF radar Network. These data are delivered together with standard deviation of near-surface zonal and meridional raw velocities, Geometrical Dilution of Precision (GDOP), quality flags and metadata. * The zonal and meridional velocities, at parking depth (mostly around 1000m) and at the surface, calculated along the trajectories of the floats which are part of the Argo Program. * The velocity profiles within the water column coming from Acoustic Doppler Current Profiler (vessel mounted ADCP, Moored ADCP, saildrones) platforms * The near-surface and subsurface velocities calculated from gliders (autonomous underwater vehicle) trajectories '''DOI (product) :''' https://doi.org/10.17882/86236
-
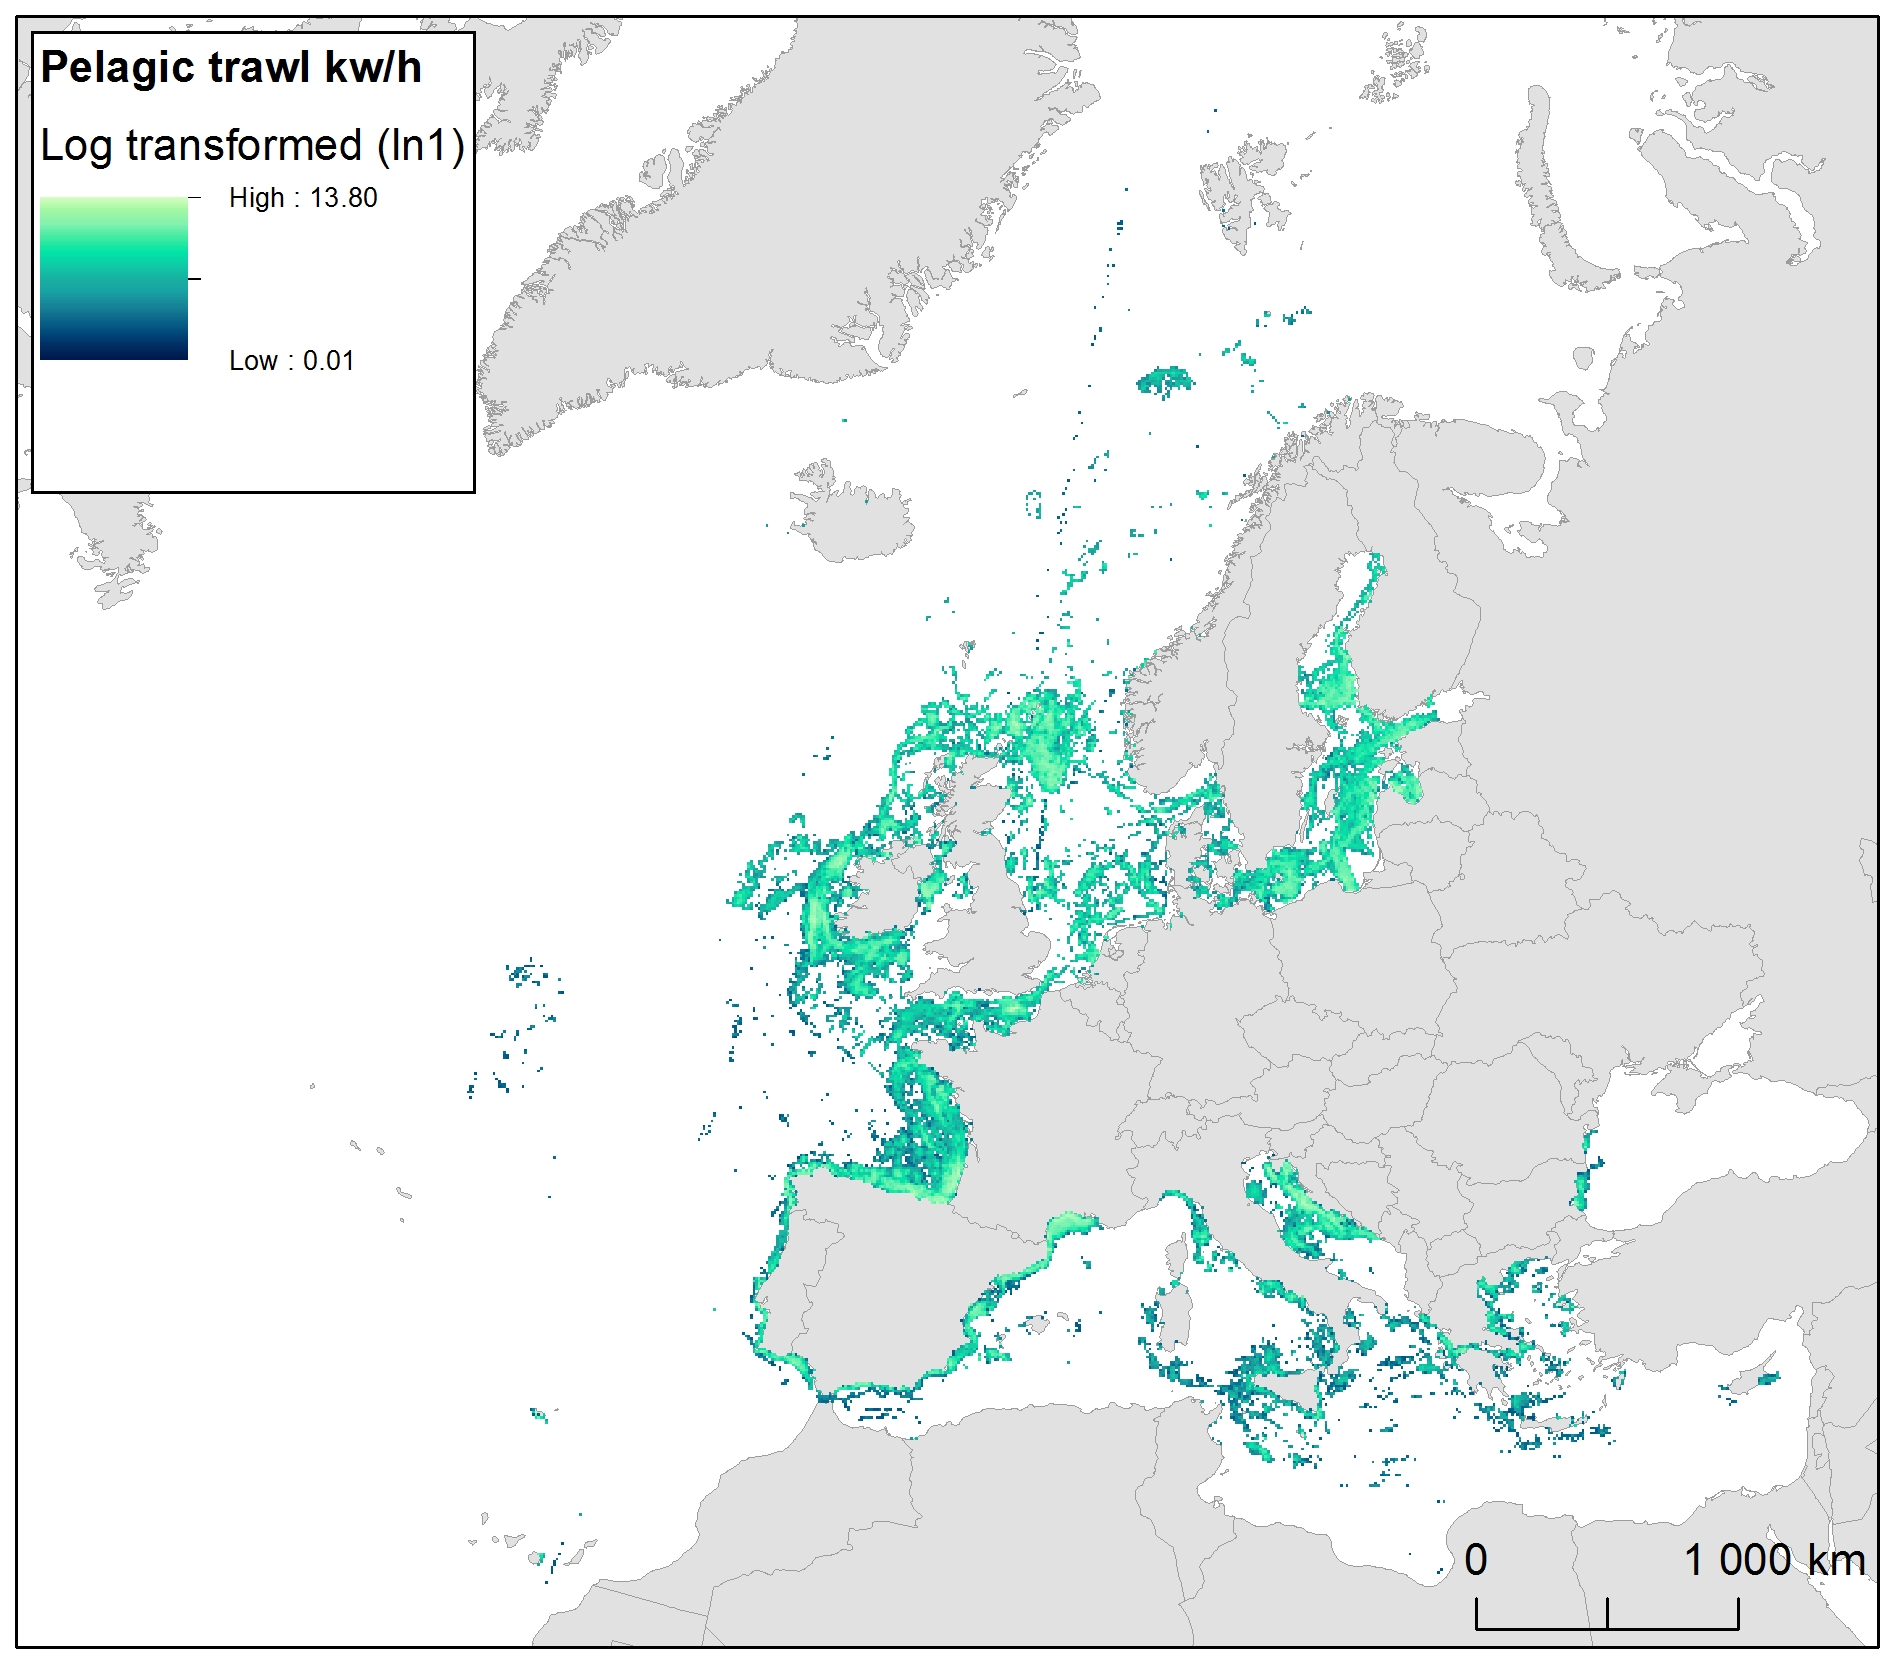
The raster dataset represents fishing intensity (kilowatt per fishing hour) by pelagic towed gears in the European seas. The dataset has been derived from Automatic Identification System (AIS) based pelagic fishing intensity data received from the European Commission’s Joint Research Centre - Independent experts of the Scientific, Technical and Economic Committee for Fisheries (JRC STECF), as well as from Vessel Monitoring System (VMS) and logbook based pelagic fishing effort data from HELCOM Commission. The temporal extent varies between the data sources (between 2013 and 2015). The dataset has been transformed to a logarithmic scale (ln1). This dataset has been prepared for the calculation of the combined effect index, produced for the ETC/ICM Report 4/2019 "Multiple pressures and their combined effects in Europe's seas" available on: https://www.eionet.europa.eu/etcs/etc-icm/etc-icm-report-4-2019-multiple-pressures-and-their-combined-effects-in-europes-seas-1.